
Introduction
Analytics is a process that can be applied to various types of data, including website traffic, customer behavior, sales data, social media engagement, and more. You may have some challenges, like not knowing who’s visiting your website and what they’re doing on your website.
You may be paying for ads, but not seeing anybody or enough people to buy your services. These are all good questions that you can answer with analytics. Collecting data and measuring website metrics can provide valuable insights into student engagement, performance, and course effectiveness.
Challenges online course teachers may encounter if they don’t track analytics on their teacher websites:
- Without tracking analytics, it can be challenging to know whether students actively engage with the course content.
- Without analytics information, it can be challenging for teachers to identify improvement areas or tailor their approach to meet student needs.
- It can lead to challenges in determining whether the course is meeting its learning objectives or whether changes need to be made.
- Challenges in providing the right type of support at the right time can lead to frustration and disengagement among struggling students.
- It can be challenging to secure ongoing support and resources for the course.
In this lesson, we’re going to learn about analytics for your teacher’s websites so that you can learn about your traffic and know what people are doing on your website, as well as what people are not doing on your website.
Video Lesson – How To Track Your Business Growth
What Are Analytics?
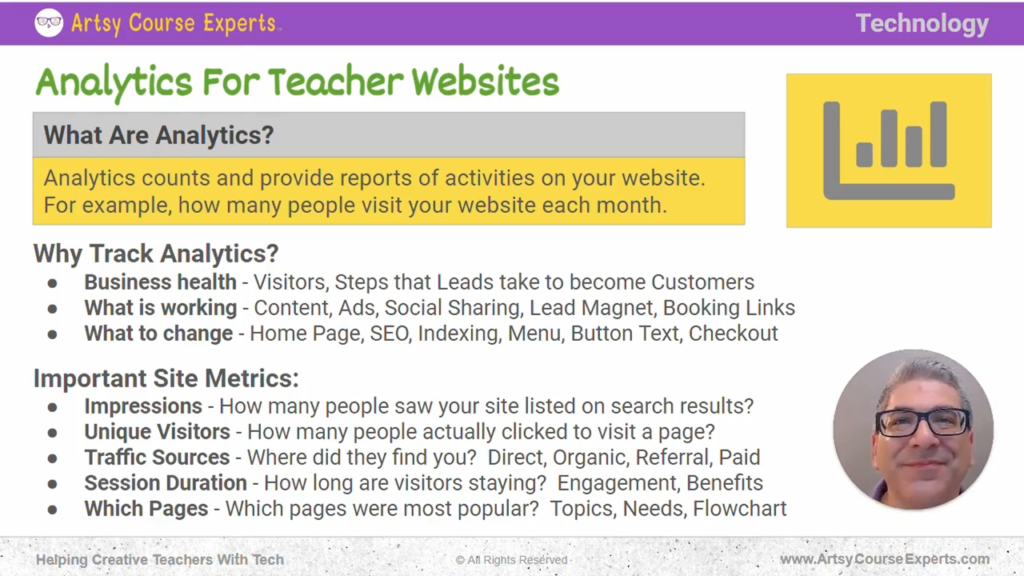
Analytics refers to the process of collecting, analyzing, and interpreting data in order to gain insights and make informed decisions. Analytics counts and provides reports of activities on your website. For example, how many people visit your website each month? Analytics are sometimes called metrics, statistics, or Key Performance Indicators (KPIs).
You can have various metrics that are your KPIs, and various stats that you’re tracking every month to see how your business is growing. These are some of the words that different people use for stats, metrics, and KPIs. We’re going to get into analytics. There are lots of different values, and some of them could be your Key Performance Indicators.
Analytics are counting very specific events that happen on your website and aggregating them into a database. Later, you can learn about:
- How many people showed up today?
- How many people showed up last month?
- How many people clicked on this thing?
Those are all different kinds of metrics that you’ll be able to know once you have analytics installed. The most popular analytics platform is called Google Analytics.
Why Track Analytics?
Regardless of what analytics package or metrics you’re using, let’s just give you a primer on what is analytics. Why would you want them for your teacher websites and other services like your community or courses so that you can see what is happening on your properties?
Business Health
It lets you know how many visitors are coming to your property every single month, day, and hour. Not only will you know the health of your business. You will know what people are specifically doing on your website that might help those visitors ultimately become customers.
Knowing high-level business health like having 1000 people this month, and 150 of them looked at my services page to see how I can help them.
What Is Working
Working Analytics lets you know which kinds of content you might have, maybe content on your blog or certain words on landing pages that resonate with your customers.
From an ads point of view, what are the different ads that are getting clicked on and making it to your webpage? For instance, as an online music teacher, which ads are students clicking on that take them to your webpage?
Social sharing lets you know what types of content they’re sharing and which of those social websites are people clicking on that come back to your webpage.
Your lead magnet, are people signing up or are they not signing up? Is it the popup? Is it the sidebar? Is it at the bottom of reading a long blog article that they’re ultimately signing up to get tips or to get your pdf, and then ultimately booking links?
Need Coaching? We Got You.
Level up your business with an experienced tech partner.

Check out our 1:1 personal pathfinder, small group leader Zooms, or quick technical audits.
You might have Calendly, ‘send me a message,’ ‘let’s have a discovery call,’ ‘send me an email,’ and ‘call me.’ Are those different pages and services working?, are they getting visitors right up to that specific page that says, ‘Hey, schedule a time now to talk’? Or are they not even making it to that booking page? You need to know all these different things.
What To Change
Analytics provides valuable insights into what to change, what’s not working, and what experiments you should try. For example, consider the content on your homepage: is it too busy? Do you have your blog there, and should it be? What’s the main message of your SEO strategy?
Check what you have configured for metadata on your various important pages. Do you have key content on your website that Google doesn’t know about? If certain pages aren’t added correctly, they won’t appear in search results.
Evaluate your menu structure. Do you have key items and the right information in the correct hierarchy order? Consider whether you go deep with three levels on your menu or stick to just one or two items on the main menu.
Examine the anchor text on your buttons and links. Are they generic? Can you make them more specific and engaging? For example, instead of “Order Now,” or “Click to Learn More,” try more compelling phrases. These changes can improve the results when visitors interact with your page or sales page
You’ll want to tweak your checkout process. If your checkout has three or four steps, consider simplifying it so customers can enter their credit card information and order your service with just one click.
There are various aspects to consider: Do you have too many fields for customers to fill out? Are people reaching your checkout page but not completing their purchase?
It could be due to an expired SSL certificate or another issue. With analytics and metrics, you’ll know where people are navigating, where they are stopping, and where they are dropping off or bouncing from your website.
Important Site Metrics
Let’s dig into some of the more popular metrics that people watch week to week, month to month for their online courses or their teacher websites.
Impressions
How many people saw your website in their search results? They searched for something and saw your website listed, perhaps on page one, two, or three. For whatever reason, they didn’t click on it.
Maybe they didn’t like the title, or it wasn’t relevant to them. However, understanding how many impressions you’re getting is important.
Unique Visitors
How many people clicked on or typed your website URL and went directly to your site? How many unique visitors, not the same person repeatedly going in and out, but distinct individuals from around the world, saw something or heard about your site and clicked on it, landing on a page on your website?
These unique visitors are very important to track.
Traffic Sources
Where did they find you? Did they know about your company and type it into their browser, or did they search for some of the keywords associated with your website and find you in the search results?
If they clicked on your site from search results, congratulations on your SEO efforts! This traffic is known as organic traffic.
Was it a referral? For example, perhaps they were on social media, like Twitter, and saw something about your site, or they were reading a blog specific to your niche and liked what you said.
These are referral links, where another website had a link to yours, and people clicked over and landed on your site.
Finally, another traffic source is a paid source. This is like advertising, so you paid for it, clicked on the ad and they went directly to a specific page on your website. Could be your homepage, but a landing page is recommended specifically for whatever it is that ad was selling.
Traffic sources are good to know, and it’s great to look at as a pie graph. Where’s my traffic coming from? And what ratios?
Session Duration
When people visit your website, how long do they stay? Do they leave within two seconds, or do they explore further? Are they hitting the back button on their browser, or are they engaged and curious about what your site offers?
Consider whether your visitors are finding your content interesting and staying longer on your website. This engagement indicates they found something of interest—they’re clicking around, reading blog articles, exploring your glossary, watching videos, or learning more about you. They might read one, two, or even three blog articles.
This is all about speaking in terms that resonate with your audience. Are you truly helping them? Are you addressing their pain points? Are you providing clear benefits to your visitors?
Which Pages
Which pages are people visiting on your website? Is it mainly the homepage, or are there specific pages they are drawn to? Are they visiting your main lead magnet, categories page, services, blog, or other areas?
Identify which pages are most popular. It might not just be the direct links in your main menu or homepage. It could be the checkout page, the signup form, or perhaps some pages are erroring out. You need to know which pages are being viewed and whether they are performing well or poorly so that you can redirect traffic as needed.
Understanding what analytics are is crucial. They are data key events for your website, typically indicating that a page was viewed.
This information is vital for the health of your business. As a business owner, lead, teacher, or coach, knowing what to change helps you improve your metrics month over month.
How Analytics Are Collected
Let’s go into an example and talk about how analytics are collected.
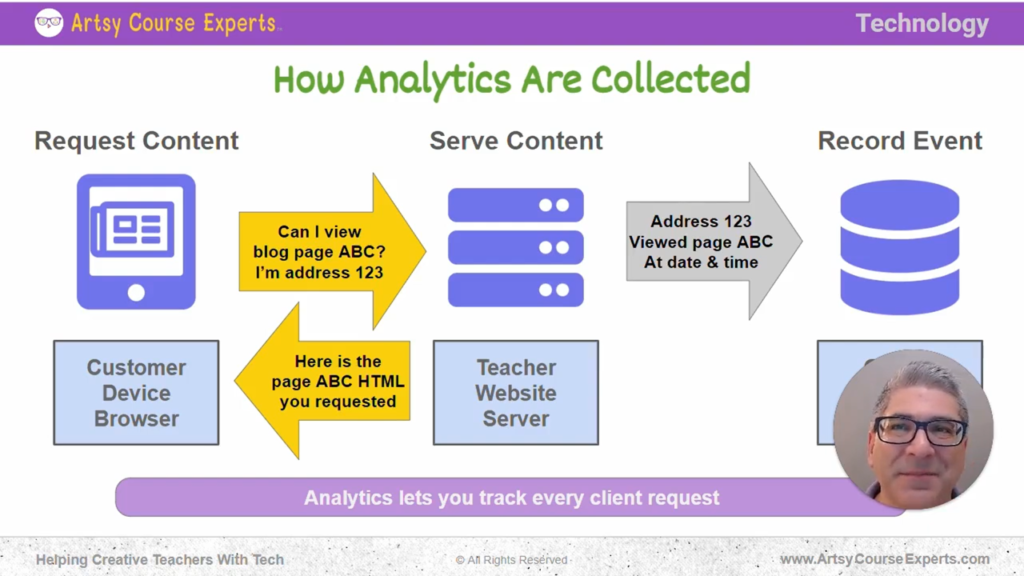
Request Content
Firstly, a visitor may want a specific piece of content from your website, such as a blog post or a particular page.
They access their browser on a tablet or computer, and their device communicates with your web server. The device essentially says, “Hi, can I please view the blog page ABC? And by the way, I’m at address 123.”
Remember, the internet works with addresses, just like houses have home addresses. Every device has an internet address called an IP address. When the visitor uses their tablet to access your website and requests a page, your web server responds to this request.
Serve Content
For example, when a visitor requests a page, WordPress might say, “Oh, this user wants this page. First of all, do I have the page? Yes, I do.”
Every time a request is made, a message is sent to your website. For instance, Google Analytics might get notified: “Hey, Google Analytics, this user from address 123 wants page ABC. Just letting you know so you can log it in your database.”
Record Event
Later, you might want to know how many people visited a specific page or your entire website. Google Analytics logs every request that comes to your web server. It notifies the server, saying, “Hey, log this event. Record this transaction where a user from this address needed this page.”
Google Analytics logs this information and then returns whatever your customer needs. In this case, it returns the HTML for page ABC to your customer. They continue to request pages as they navigate your site.
Each time they request a page from your web server, it notifies Google Analytics: “Hey, somebody just asked for this. Track it real quick. I don’t need the details, just log this event,” and then it returns the results so the visitor can continue browsing without waiting too long.
That’s how analytics systems communicate with each other behind the scenes. From your perspective, they allow you to track every single client request, and later, you can analyze all that data in detail.
Frequently Asked Questions About Analytics for Teacher Websites?

Summary – Analytics for Teacher Websites
Analytics for teacher websites can offer valuable insights for online educators looking to enhance their teaching strategies and optimize the learning experience for their students.
By tracking metrics such as engagement rates, resource usage, and assessment performance, educators can pinpoint areas for improvement and tailor their approach to better meet students’ needs.
It’s crucial for teachers to regularly review and analyze this data to ensure continuous improvement in the online learning experience. With the right tools and strategies, analytics can be a powerful resource for boosting student engagement and performance in online courses.
We recommend reviewing your statistics every month and using those insights to discuss any issues and opportunities with your team.
Tips for using analytics for your teacher website:
- Set up Analytics on each of your main platforms like website, course, community
- Identify a few Key Performance Indicators (KPIs); the main things that you’re going to track
- Start making little changes one at a time so that you can improve your performance like getting students to stay longer and prospects to buy more often
- After each successful experiment, update your website and start a different test
If you do one thing, at least install some sort of analytics package now like google analytics, so when you’re ready to optimize, you’ll have months or years of data.
You should be a little smarter now. Thanks for hanging out!
Please subscribe to get more tips for creative online course teachers.
More Tips For Online Teachers
These lessons can also help you with Administration and Technology:
- Video Hosting Options For Online Courses
- Stripe Payment Fundamentals For Online Course Teachers
- Analyzing E-learning Checkout Process
- Email Addresses for Online Courses
- What are HTTP Status Codes And How Browsers Request Information?